Page 1 of 1
Multiple plots for Density
Posted: Sat 22 Mar 2025 14:55
by wtam
Dear Didier,
Charts->Envelope supports multiple plots. Is it possible to enable multiple plots for Charts->Density?
Best regards,
Wai-Ming
Re: Multiple plots for Density
Posted: Mon 24 Mar 2025 10:18
by Didier
Dear Wai-Ming,
I'll think about it, but it might be a big development that I'm not sure I'm up to at the moment. That said, you can always use chart_envelope in ‘partran’ mode using the dtl1.plt file via the PlotWin tool. This is heavier and slower because it is not based on a denity file but on the plt file which contains all the particles at all the saved positions.
Regards,
Didier
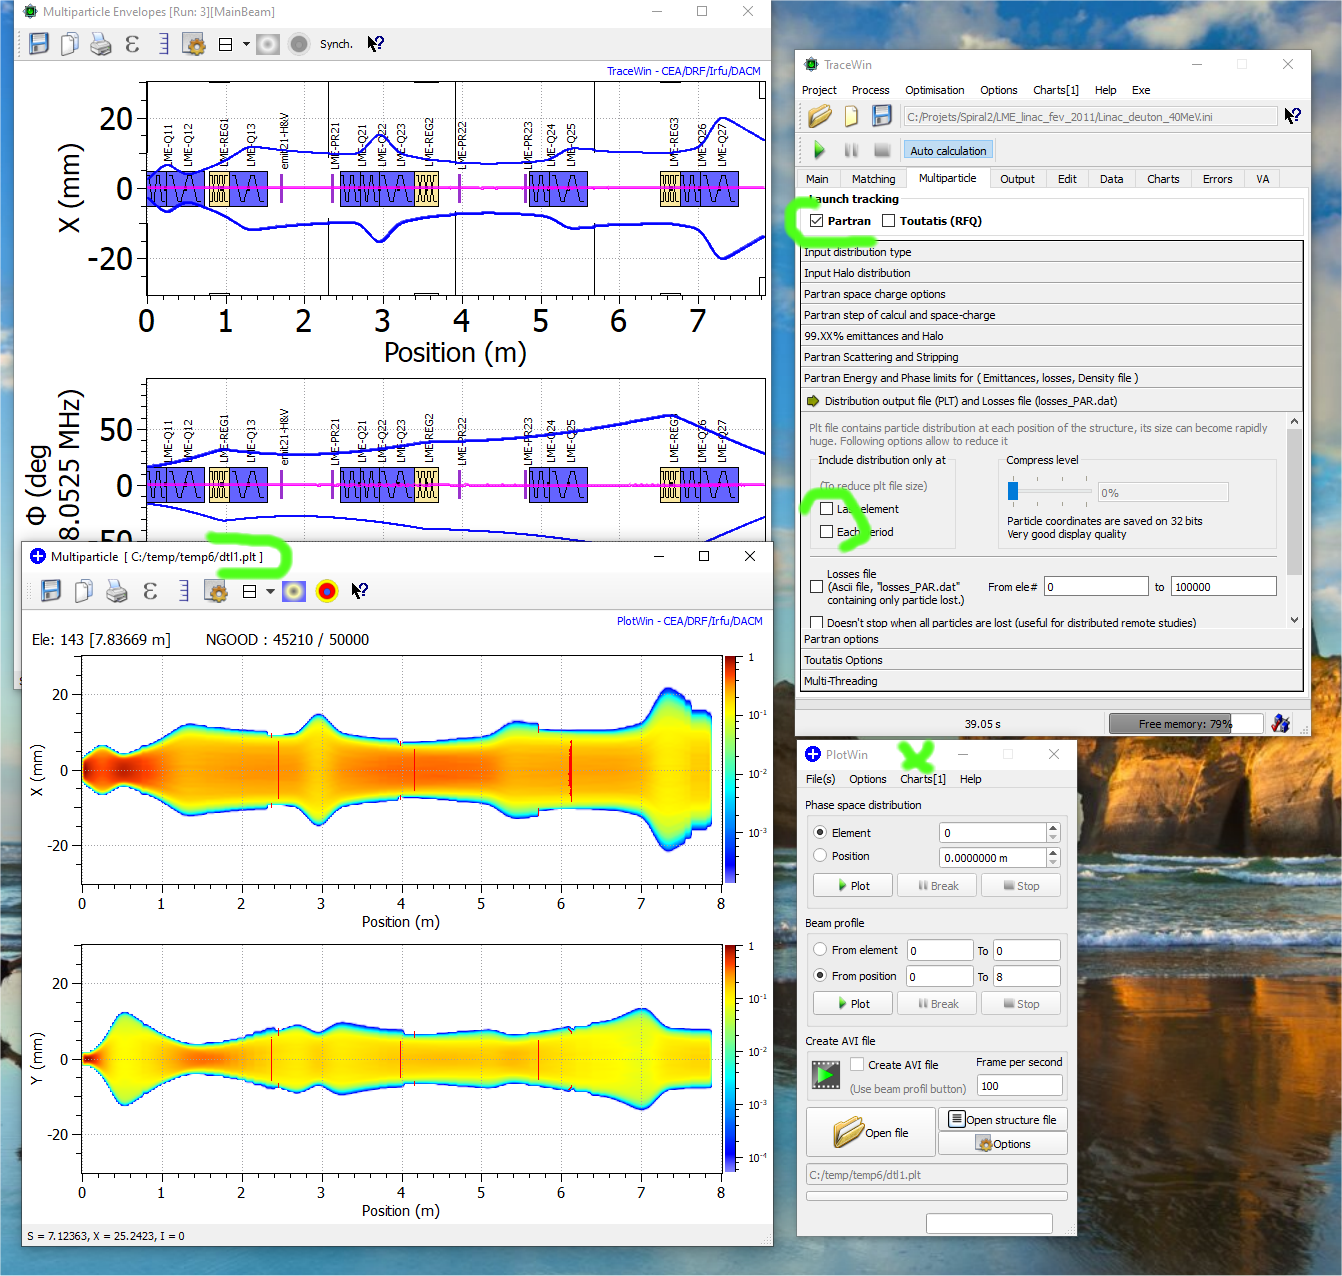
- plotwin.png (591.76 KiB) Viewed 7718 times
Re: Multiple plots for Density
Posted: Wed 26 Mar 2025 18:00
by wtam
Dear Didier,
Great! It is more than a workaround. The quality of the plots is much higher in PlotWin. Thank you.
I usually use the synch. button for live update, which is available in chart_density but not in PlotWin. May I ask if it can be added to PlotWin?
Best regards,
Wai-Ming
Re: Multiple plots for Density
Posted: Wed 2 Apr 2025 10:50
by Didier
Dear Wai-Ming,
I've improved PlotWin to allow a “synchronization function” similar to TraceWin. So it's a bit experimental, so...
Regards,
Didier
Re: Multiple plots for Density
Posted: Thu 3 Apr 2025 04:16
by wtam
Dear Didier,
Thank you! I appreciate it!
Clicking Charts->PlotWin does not launch PlotWin. It worked before the upgrade. I am running Windows 10. Do you have any idea?
Best regards,
Wai-Ming
Re: Multiple plots for Density [SOLVED]
Posted: Thu 3 Apr 2025 10:29
by Didier
Dear Wai-Ming,
Bug fixed in PlotWin.
So, upgrade it to fix that.
Regards,
Didier
Re: Multiple plots for Density
Posted: Fri 4 Apr 2025 20:46
by wtam
Dear Didier,
It works well. Thanks!
Best regards,
Wai-Ming